How to make a report by number of likes, comments, and repost?
What records are needed?
firstly, if you want to keep the statistics and analysis on the computer, so much so that always and everywhere were opened;
secondly, to print out and show your employees or co-workers, and analyze statistics;
thirdly, for the daily, monthly, quarterly and other reports before the authorities.
Let's just move on to how to make reports:
First, you need to login on the service Feedspy.net under any social network. In our case, Facebook.
Let us analyze the desired page and get detailed analytics page:
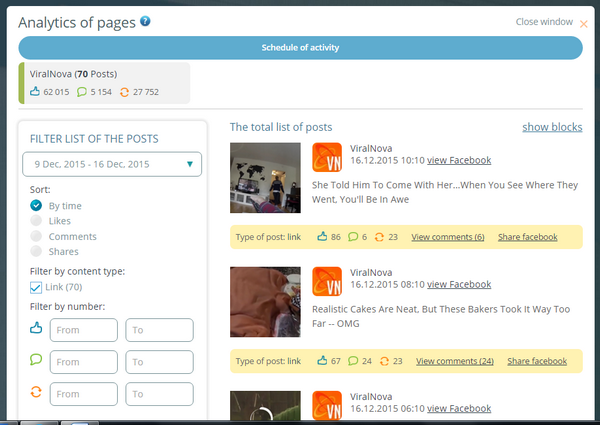
Click on the "Schedule of activity":

And we can see the following schedules:
1) the main, in which you can choose what to show us - likes, comments, repost or general;
2) Activity hourly;
3) Activity this week.
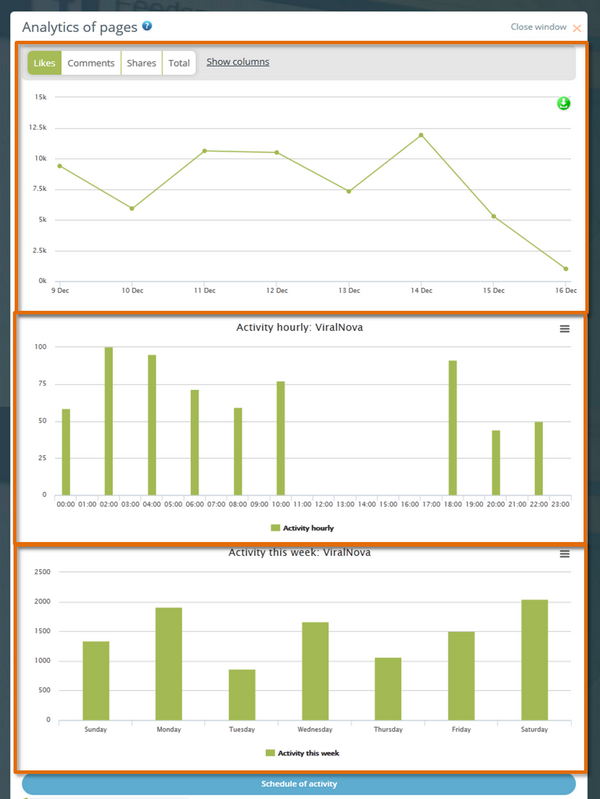
On the main graph, you can set the parameters for which we need a schedule. By default, the schedule is displayed by the likes of the week.
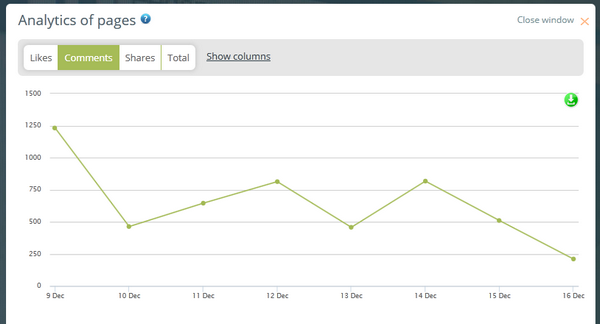
Schedule of comments is shown below.
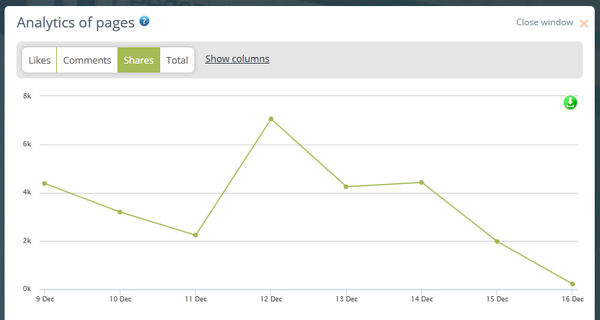
Repost graph shows the average 5000 repost a day.
As you can see, the main graph has a green button.
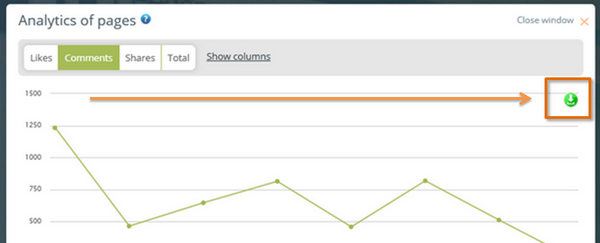
By clicking on the button displayed a drop-down menu:
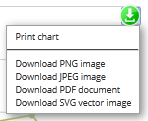
We can print the schedule, if we press on the "Print chart".
And you can also download the schedule in the format of PNG, JPG, PDF.
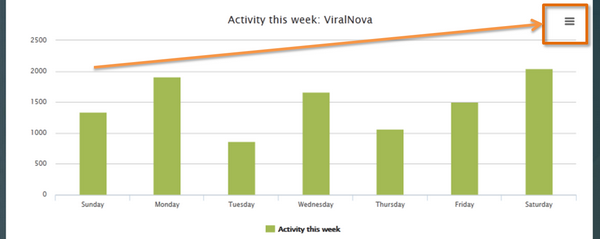
Schedules ofactivity by hour and for the week as you can print and download in a convenient format you need with the help of the button:
So, if everything is clear with graphs, let's download statistics by the posts in Excel.
To download Excel, you need to go in the "Filter list of the posts" and click on the "Download Excel":
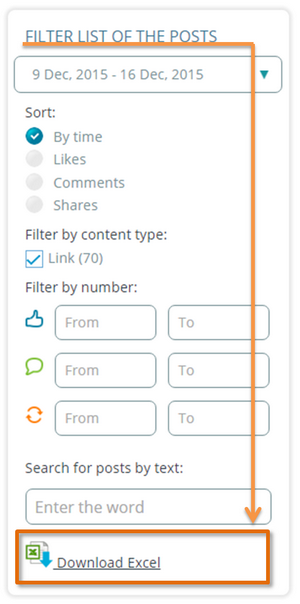
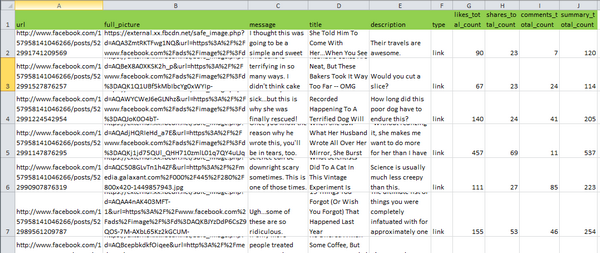
Browser saves and opens our document in Excel. We see the statistics by the posts:
1) url - post link;
2) full_picture - the full path of the image of the post;
3) message - text of the post;
4) tile - the title of the post;
5) description - brief description of the post;
6) type - the type of post. Maybe photo (pictures), repost (repost), video (video). It is necessary to filter out the positions of the type that you need. If you need videos, you can search by the type of video.
7) likes_total_count - the number of likes of the post;
8) shares_total_count - the number of repost of the post;
9) comments_total_count - the number of comments of the post;
10) summary_total_count - the total number of likes, comments and repost.
Why do you need a table with all numbers?
In this document you will be able to watch all the statistics in numbers and not in graphs and rely on accurate numbers.
Results:
All statistics and analytics that you see on our wonderful service FeedSpy, you can upload to your computer, print and show to their employees and customers. Demonstrate the success of your groups, communities, and pages.
